✕


We have received valuable recognition: BiXPERT Kft. has been awarded the 2026 OPTEN “Excellent Company” qualification. This recognition is granted to companies...
Read more
We have received valuable recognition: BiXPERT Kft. has been awarded the 2026 OPTEN “Excellent Company” qualification. This recognition is granted to companies...
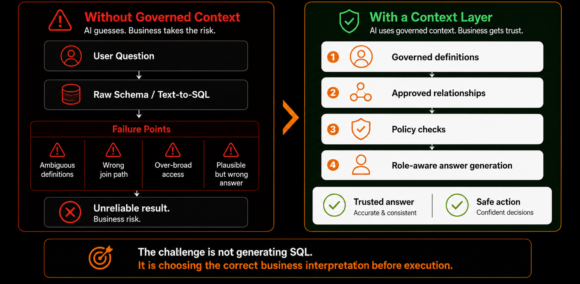
Enterprise AI does not only need more data. It needs the right business context. A semantic layer helps provide that context by...

For many organizations, FP&A is still mainly associated with budgeting, forecasting, variance analysis, and monthly reporting. These activities remain important, but they...

For many Finance teams, board reporting is still a time-consuming, manual process. Data needs to be collected from different systems, checked, aligned,...

Date: 16 April 2026, Thursday Time: 9:00 – 13:00 Location: Mercure Budapest Castle Hill(1013 Budapest, Krisztina körút 41-43.) Agenda 1. Welcome &...
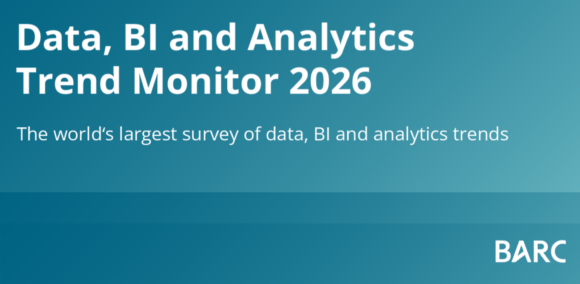
Every organization today talks about AI. Fewer talk about data foundations. And even fewer manage to connect the two. The latest global...
© 2026 Bixpert. All Rights Reserved.

